Getting Started with spacefinder
getting-started.RmdIntroduction
The spacefinder package helps you identify promising
hyperparameter subspaces from benchmark data. Instead of exploring the
entire hyperparameter space, you can focus on regions that consistently
produce high-performing models.
Example Data
We’ll use the included benchmark_data dataset, which
contains synthetic hyperparameter tuning results:
data("benchmark_data", package = "spacefinder")
head(benchmark_data)
#>      task learning_rate max_depth optimizer       auc
#>    <char>         <num>     <num>    <char>     <num>
#> 1:  task1  1.669706e-03        11       SGD 0.8732184
#> 2:  task1  7.156343e-04        10       SGD 0.8407793
#> 3:  task1  3.214906e-03         8       SGD 0.9680098
#> 4:  task1  5.028091e-05         7       SGD 0.7771257
#> 5:  task1  1.855155e-03        12       SGD 0.8427566
#> 6:  task1  2.585816e-03         3       SGD 0.7729911

# Summary statistics
summary(benchmark_data$auc)
#>    Min. 1st Qu.  Median    Mean 3rd Qu.    Max.
#>  0.5000  0.5672  0.6777  0.7080  0.8435  1.0000
cat("\nConfigurations with AUC > 0.9:", sum(benchmark_data$auc > 0.9), "\n")
#>
#> Configurations with AUC > 0.9: 1241
The dataset includes: - 5 tasks (different datasets) - 200
configurations per task - Hyperparameters: learning_rate,
max_depth, optimizer - Performance:
auc (Area Under ROC Curve)
Creating a Task
Define a subspace task specifying the data, target measure, and hyperparameters:
task <- TaskSubspace$new(
  data = benchmark_data,
  target_measure = "auc",
  hps = c("learning_rate", "max_depth")
)

# Alternative: formula interface
task <- TaskSubspace$new(
  data = benchmark_data,
  formula = auc ~ (learning_rate + max_depth)
)
Training a Learner
We’ll use the Box learner, which fits axis-aligned hyperrectangles (simple bounds per hyperparameter):
# Initialize learner
learner <- LearnerSubspaceBox$new(task)

# Train on top 10% of configurations
learner$train(q_val = 0.9)
The q_val = 0.9 parameter means we use only
configurations with performance above the 90th percentile (top 10%) for
each task.
Extracting Results
Coefficients
Get the fitted hyperparameter bounds:
bounds <- coef(learner)
print(bounds)
#>    hyperparameter          min         max
#>            <char>        <num>       <num>
#> 1:  learning_rate 5.064595e-05  0.06800025
#> 2:      max_depth 3.000000e+00 15.00000000
The learned optimal ranges: - learning_rate: between
0.0001 and 0.0680 - max_depth: between 3 and 15
Summary
Get a comprehensive overview:
summary(learner)
#> SUMMARY
#> --------------------------------------------------
#> Property                      Value
#> ----------------------------  -------------------------
#> Target Measure                auc
#> Numeric Hyperparameters       learning_rate, max_depth
#> Categorical Hyperparameters   None
#>
#>
#> COEFFICIENTS
#> --------------------------------------------------
#> hyperparameter         min          max
#> ---------------  ---------  -----------
#> learning_rate     5.06e-05    0.0680003
#> max_depth         3.00e+00   15.0000000
#>
#>
#> STATUS
#> --------------------------------------------------
#>  observations
#>  -------------
#>  750
The summary shows: - Summary: Task information - Coefficients: Fitted bounds - Status: Number of observations used for fitting
Visualization
Visualize the fitted subspace:
autoplot(learner)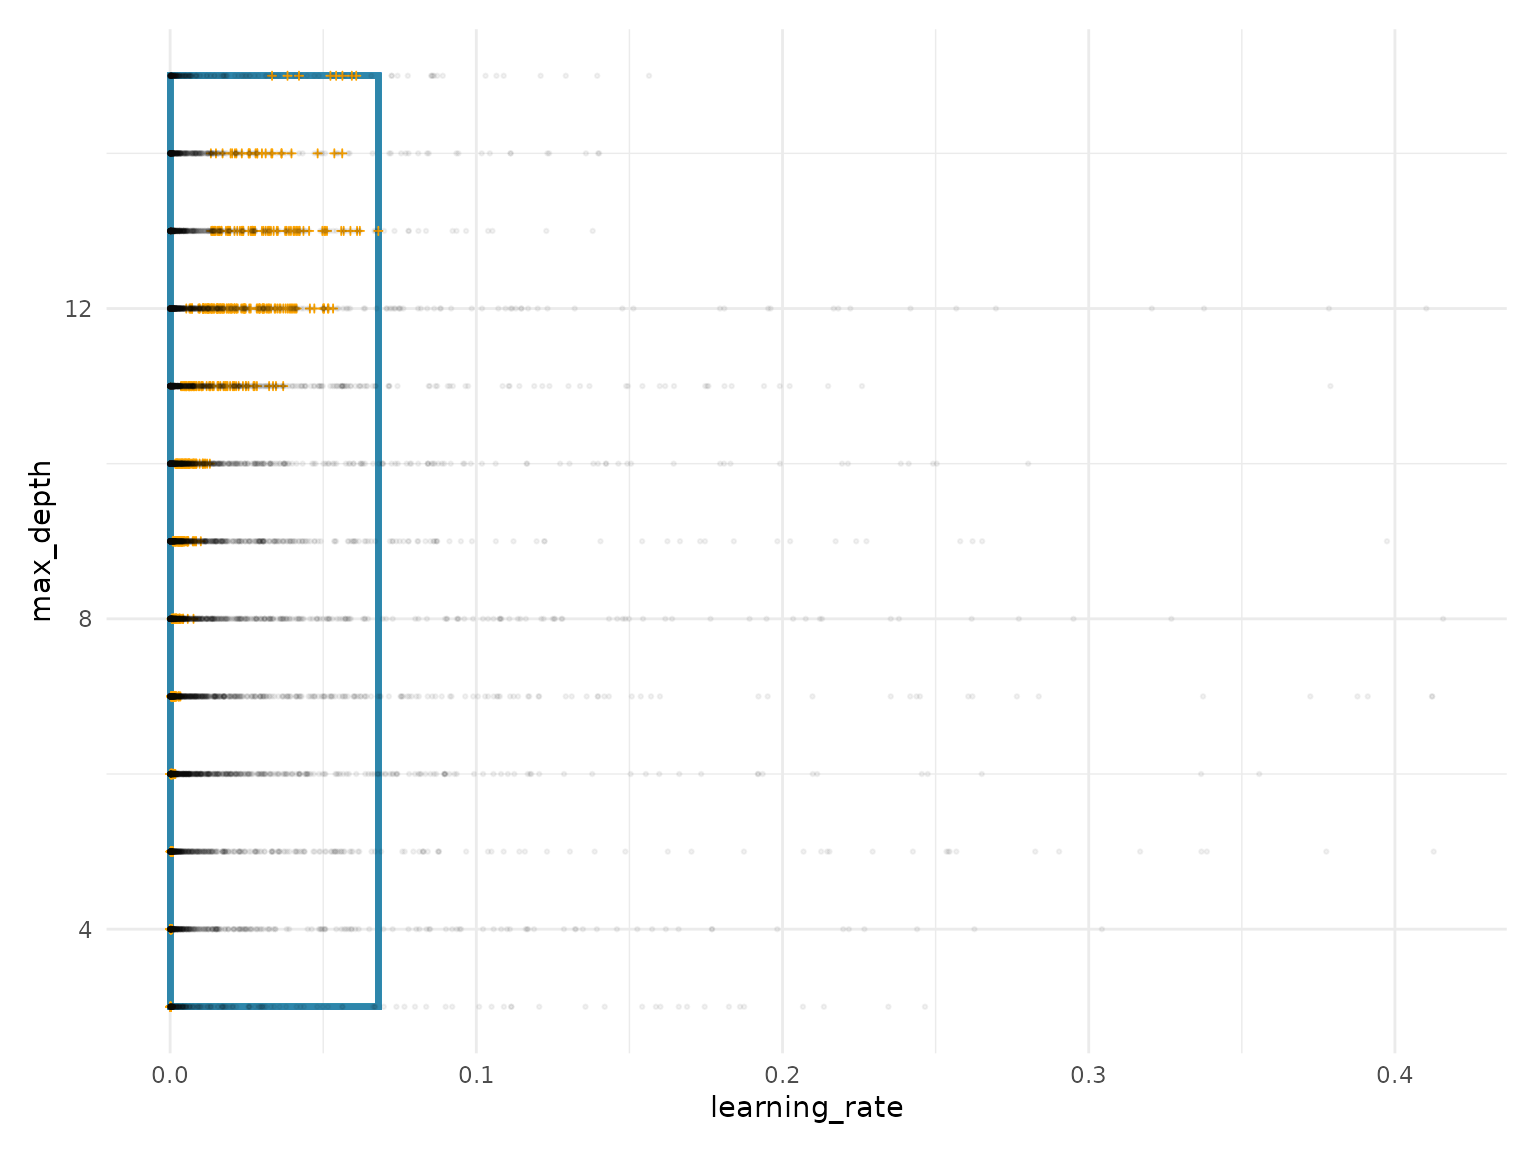
The plot shows: - Blue rectangle: Fitted subspace bounds - Orange crosses: Top-performing configurations used for fitting - Gray points: All configurations (background)
Next Steps
Learn more about spacefinder:
-
vignette("categorical-hyperparameters"): Handle categorical variables (e.g., optimizers) -
vignette("learner-comparison"): Compare Box, Polygon, and Ellipsoid learners -
vignette("density-estimation"): Add probabilistic density withaugment()
Session Info
sessionInfo()
#> R version 4.5.2 (2025-10-31)
#> Platform: x86_64-pc-linux-gnu
#> Running under: Ubuntu 24.04.3 LTS
#>
#> Matrix products: default
#> BLAS:   /usr/lib/x86_64-linux-gnu/openblas-pthread/libblas.so.3
#> LAPACK: /usr/lib/x86_64-linux-gnu/openblas-pthread/libopenblasp-r0.3.26.so;  LAPACK version 3.12.0
#>
#> locale:
#>  [1] LC_CTYPE=C.UTF-8       LC_NUMERIC=C           LC_TIME=C.UTF-8
#>  [4] LC_COLLATE=C.UTF-8     LC_MONETARY=C.UTF-8    LC_MESSAGES=C.UTF-8
#>  [7] LC_PAPER=C.UTF-8       LC_NAME=C              LC_ADDRESS=C
#> [10] LC_TELEPHONE=C         LC_MEASUREMENT=C.UTF-8 LC_IDENTIFICATION=C
#>
#> time zone: UTC
#> tzcode source: system (glibc)
#>
#> attached base packages:
#> [1] stats     graphics  grDevices utils     datasets  methods   base
#>
#> other attached packages:
#> [1] ggplot2_4.0.1          data.table_1.18.0      spacefinder_0.2.2.0000
#>
#> loaded via a namespace (and not attached):
#>  [1] Matrix_1.7-4       bit_4.6.0          gtable_0.3.6       jsonlite_2.0.0
#>  [5] Rmpfr_1.1-2        compiler_4.5.2     Rcpp_1.1.0         jquerylib_0.1.4
#>  [9] systemfonts_1.3.1  scales_1.4.0       textshaping_1.0.4  yaml_2.3.12
#> [13] fastmap_1.2.0      lattice_0.22-7     R6_2.6.1           labeling_0.4.3
#> [17] patchwork_1.3.2    generics_0.1.4     knitr_1.51         backports_1.5.0
#> [21] checkmate_2.3.3    desc_1.4.3         bslib_0.9.0        RColorBrewer_1.1-3
#> [25] rlang_1.1.6        cachem_1.1.0       CVXR_1.0-15        xfun_0.55
#> [29] S7_0.2.1           fs_1.6.6           sass_0.4.10        bit64_4.6.0-1
#> [33] cli_3.6.5          withr_3.0.2        pkgdown_2.2.0      digest_0.6.39
#> [37] grid_4.5.2         gmp_0.7-5          lifecycle_1.0.4    vctrs_0.6.5
#> [41] evaluate_1.0.5     glue_1.8.0         farver_2.1.2       ragg_1.5.0
#> [45] rmarkdown_2.30     tools_4.5.2        htmltools_0.5.9